Code Profilling
gprof Quick Start♯
gprof is known as a compiler that helps you understand where your code spent its time and what functions is called during the running time. It also generates the report in the graph format using grof2dot, which shows you in detailed how many times each function is called. To use gprof, follow the steps below:
Compiling♯
Recompile your code using the -pg argument to the compiler’s command line or add -pg to the FLAGS in the Makefile. This helps produce an executable which has debugging, and profiling turned on. Example: add -pg to the Makefile to generate the executable NB.run:
CC=g++ -std=c++11 -pthread
OPT=-O0 -pg
Generate gmon.out♯
After recompiling, run your program and wait until complete to create a gmon.out file. This gmon.out contains
Run gprof♯
Run the gprof using the command like this: gprof program-name gmon.out > gprof.out gprof.out is the output that will be examined later, or you can name it using your program’s name.
Analyzing the output♯
Format the report of gprof to be a graph using gprof2dot[1]: gprof2dot -s gprof.out | dot -Tpng -o output.png The output is a graph looks like this:
and side the graph:
+------------------------------------+
|        function name               |
| total time % ( self time % ) |
|         total calls                |
+------------------------------------+
where:
- total time % is the percentage of the running time spent in this function and all its children;
- self time % is the percentage of the running time spent in this function alone;
- total calls is the total number of times this function was called (including recursive calls).
An edge represents the calls between two functions and has the following layout:
           total time %
              calls
parent --------------------> children
Where:
- total time % is the percentage of the running time transferred from the children to this parent (if available);
- calls is the number of calls the parent function called the children.
perf (Linux Performance Counters)♯
perf is the Linux kernel's built-in profiler. Unlike gprof it needs no recompilation: it samples a running program using hardware performance counters and reports where time is spent, down to the function level. It is installed as an environment module:
module load perf
Run perf inside a job on a compute node, not on the login node. For example, start an interactive session first:
srun -p def -n 1 --pty bash
module load perf
Counting events♯
perf stat runs a program and prints totals for cycles, instructions,
cache misses, and so on:
perf stat -e task-clock,cycles,instructions,cache-misses ./myprogram arg1 arg2
Finding hot spots♯
perf record samples a program and writes the samples to perf.data
in the current directory. perf report then summarizes them by
function:
perf record -g ./myprogram arg1 arg2
perf report --stdio | less
For readable function names compile with -g. For accurate call graphs
(the -g option to perf record) also compile with
-fno-omit-frame-pointer, or use perf record --call-graph dwarf
instead, which works without frame pointers at the cost of much larger
perf.data files.
To see the raw samples, or feed them to other tools such as
FlameGraph, use
perf script.
Limitations♯
Regular users can profile only their own processes, and only the
user-space part of them. Counters are reported with a :u suffix (for
example cycles:u) to indicate this. System-wide modes such as
perf top and perf record -a, and anything that samples inside the
kernel, are not available.
Valgrind - Memcheck♯
Valgrind[2] is a tool that helps to debug and profile your program to make it run faster and more concise and accurate. This article shows you how to use Memcheck to detect many memory-related errors that may occur while running your program. These errors are common in C and C++ which may cause your program to crash.
Prepare your program♯
Compile your code using the -g following by one of these options: -O0, -O1
Run program with Memcheck♯
Run your program using this format: Valgrind - -leak-check-=yes myprogram arg1 arg2 Now your program will run slower and use more memory than regular (up to 30times slower).
Output♯
Common messages will have the format below:
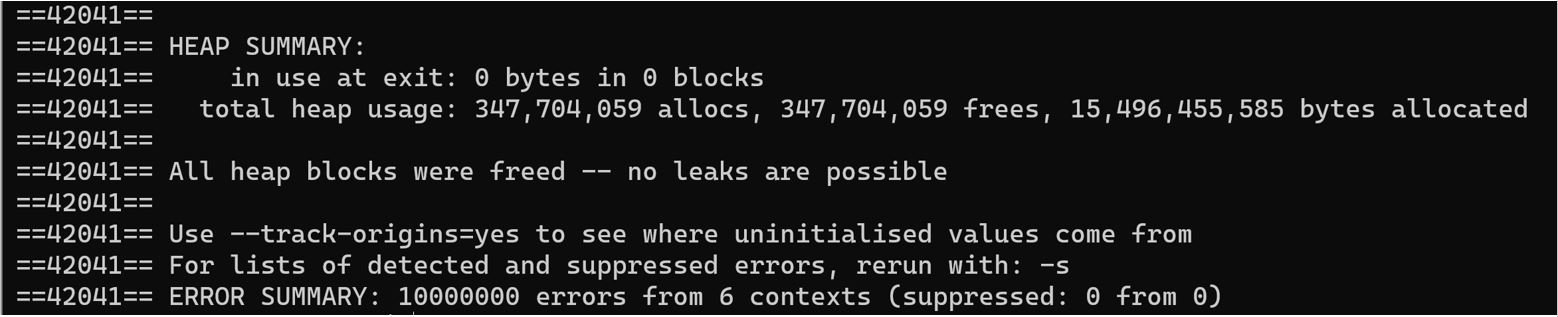
Usually, the number 42041 is just the process id, so it is not important. These messages on the right side will contains a lot of important information, so read them carefully. Sometimes you will get a recommendation to rerun your program with different options to explore more about your program.
See also♯
References♯
[1] gprof2dot
[2] Valgrind